- Impeller diameter
- Propeller degree
- Speed
- Number of stages
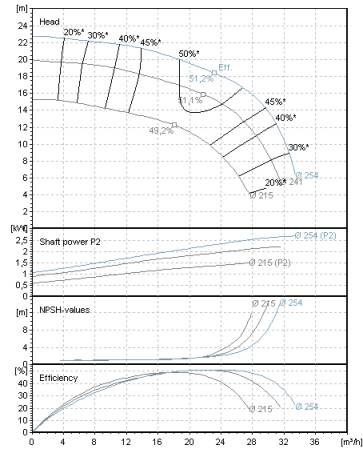
Pump Performance Chart
The performance curves differ in exact one parameter, such as

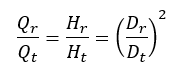 Q = flow rate
H = delivery head
D = impeller diameter
r = index for the reduced impeller diameter
t = index for the reference wheel diameter
The throttle curve H (Q) can be roughly determined from this relationship.
A more precise calculation, however, requires the consideration of performance charts in which an impeller diameter is assigned to each performance curve. The new performance curve is determined by interpolating the conversion from the neighboring curves. In order to fully utilize the efficiency of the method, it is recommended to record an duty chart with at least three performance curves. If there is a large difference between the smallest and largest impeller diameter, some (2..4) intermediate curves are required.
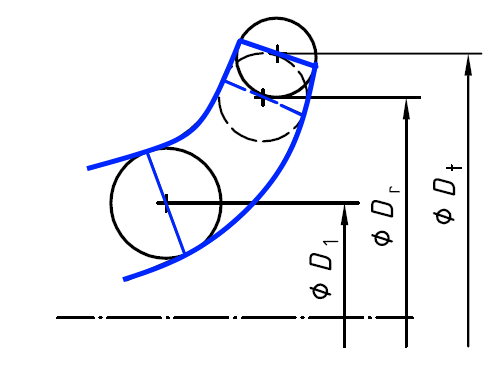
An alternative calculation method is described in ISO 9906. Knowledge of the mean impeller diameter at the leading edge D 1 is required here. According to the standard, this procedure is valid for
Q = flow rate
H = delivery head
D = impeller diameter
r = index for the reduced impeller diameter
t = index for the reference wheel diameter
The throttle curve H (Q) can be roughly determined from this relationship.
A more precise calculation, however, requires the consideration of performance charts in which an impeller diameter is assigned to each performance curve. The new performance curve is determined by interpolating the conversion from the neighboring curves. In order to fully utilize the efficiency of the method, it is recommended to record an duty chart with at least three performance curves. If there is a large difference between the smallest and largest impeller diameter, some (2..4) intermediate curves are required.
An alternative calculation method is described in ISO 9906. Knowledge of the mean impeller diameter at the leading edge D 1 is required here. According to the standard, this procedure is valid for
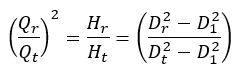 D 1 = Mean diameter at the impeller leading edge
For pumps with a type number K ≤ 1.0 and a maximum impeller diameter reduction of 3%, the efficiency can be considered as unaltered.
D 1 = Mean diameter at the impeller leading edge
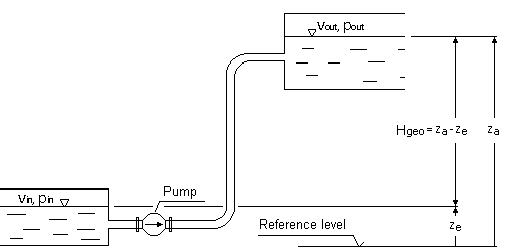
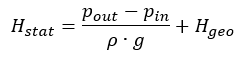
For pumps with a type number K ≤ 1.0 and a maximum impeller diameter reduction of 3%, the efficiency can be considered as unaltered. 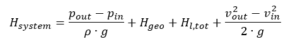 pin, pout = pressures on suction respectively discharge liquid levels
ρ = fluid density
g = gravity (9.81 m/s2)
Hgeo = static height difference between suction and discharge liquid levels
Hl,tot = total pipe friction loss between inlet and outlet areas
vin, vout = mean flow velocities at inlet and outlet liquid level areas
The mean flow velocities at the inlet and outlet areas are, based on the Continuity Law, mostly insignificantly small and can be neglected, if the tank areas being relatively large compared to those of the pipe work. In this case, above formula will be simplified to:
pin, pout = pressures on suction respectively discharge liquid levels
ρ = fluid density
g = gravity (9.81 m/s2)
Hgeo = static height difference between suction and discharge liquid levels
Hl,tot = total pipe friction loss between inlet and outlet areas
vin, vout = mean flow velocities at inlet and outlet liquid level areas
The mean flow velocities at the inlet and outlet areas are, based on the Continuity Law, mostly insignificantly small and can be neglected, if the tank areas being relatively large compared to those of the pipe work. In this case, above formula will be simplified to:
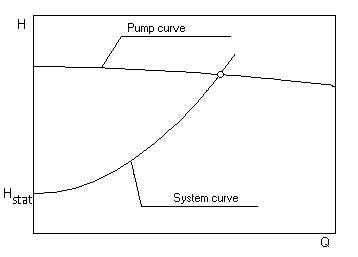
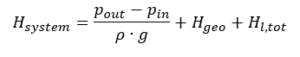 The static portion of the system H-Q curve, that part that is unrelated to the rate of flow, reads:
 For closed circulating systems this value becomes zero.
The total friction losses are the sum of the frictional losses of all components in the suction and delivery piping. They vary, at sufficiently large REYNOLDS numbers, as the square of the flow rate.
For closed circulating systems this value becomes zero.
The total friction losses are the sum of the frictional losses of all components in the suction and delivery piping. They vary, at sufficiently large REYNOLDS numbers, as the square of the flow rate.
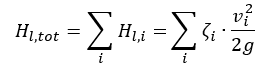
 g = gravity (9.81 m/s2)
Hl,tot = total friction loss between inlet and outlet areas
vi = mean flow velocities trough pipe cross-section area
Ai = characteristic pipe cross-sectional area
ζi = friction loss coefficient for pipes, fittings, etc.
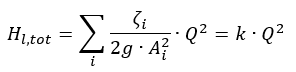
Q = flow rate
k = proportionality factor
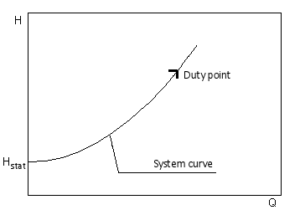
Under the above stated premises the parabolic system H-Q curve can now be drawn:
g = gravity (9.81 m/s2)
Hl,tot = total friction loss between inlet and outlet areas
vi = mean flow velocities trough pipe cross-section area
Ai = characteristic pipe cross-sectional area
ζi = friction loss coefficient for pipes, fittings, etc.
Q = flow rate
k = proportionality factor
Under the above stated premises the parabolic system H-Q curve can now be drawn:
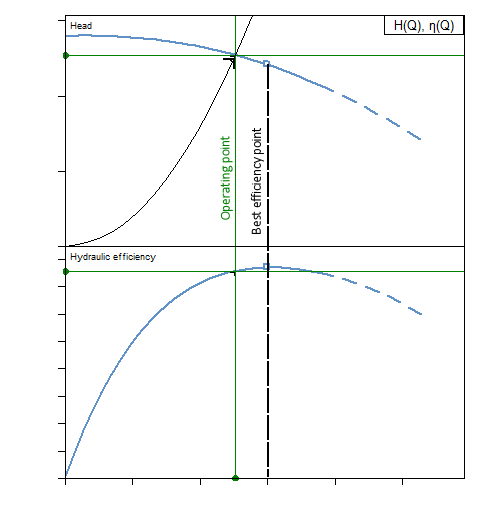
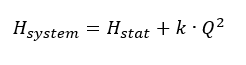 The proportionality factor k is determined of the specified duty point. The intersection of the system H-Q and the pump H-Q curves defines the actual operating point.