Measuring Greenland Ice Melt with Xylem’s SonTek Technology
A team of field researchers has been studying the Greenland ice sheet to answer some important questions: How quickly is meltwater running into the ocean? How is the meltwater speeding or slowing the movement of the glacier itself? Aided by Xylem’s SonTek technology, the researchers studied how the flow of supraglacial rivers, the streams of meltwater that race across the top of the ice sheet, change during the day.
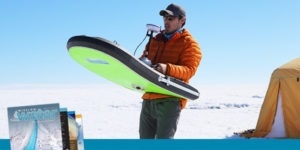
Brandon Overstreet with the SonTek RiverSurveyor M9 mounted on a HydroBoard II (Courtesy of Lincoln Pitcher)
Their field data will help improve the accuracy of mathematical models of glacial melting.
Studying how the Greenland ice sheet is melting
The Greenland ice sheet is 2,400 km (1,500 miles) long and includes 2.8 million cubic kilometers (684,000 cubic miles) of ice. Elevation breaks the glaciers that comprise the Greenland ice sheet into distinct zones.
Most meltwater research has only been done on rivers at the edges of the ice sheet. In 2012, however, an expedition led by UCLA’s Laurence C. Smith and Rutgers professor Asa Rennermalm provided rare direct discharge measurements of rivers actually on the glaciers. This zone of the ice sheet, where runoff is high, is perfect for studying how the sheet is melting as the climate changes.
The team’s 2012 fieldwork was revolutionary, proving that the latest tools and techniques from the temperate world could be used successfully in the Arctic.
Three days of glacial river monitoring
In 2015, Smith, Rennermalm and their team returned to southwestern Greenland to study meltwater runoff over three solid days of uninterrupted monitoring. If the 2012 expedition provided snapshots of the movement of meltwater, the 2015 research – and their follow-up 2016 study that measured the same stream hourly for seven days straight – delivered a movie.
“In 2012, supraglacial stream flow data – especially in large streams in the interior of the Greenland ice sheet – remained sparsely studied, so our strategy was just ‘capture data from as many rivers as possible,’” explains Brandon Overstreet, a University of Wyoming graduate student on the expedition. “But if you capture that discharge at just one point in time, you’re missing a big part of the picture. In 2015, we went back to focus on one river and see how discharge changes diurnally.”
Field data did not match model predictions
The Smith/Rennermalm team chose a supraglacial river to study, which they named Rio Behar after a colleague. For 72 hours straight, they measured stream flow, as well as detailed weather readings. They built a real-life database of water movement and conditions at the site. They then teamed up with modeling teams who ran models with meteorological data from the site to compare their field data with the model outputs.
The team found that the surface mass balance models overestimated the runoff by 21 to 58 percent. The team also noted a lag time of 0.4 to 9.5 hours between periods of high melting and increases in river discharge that was not reflected in the model predictions.
Figuring out how to measure large fluctuations in flow
One of the most notable aspects of the diurnal cycle in meltwater flow was the sheer size of the fluctuations. Flow in Rio Behar could range from 4.61 to 26.73 cubic meters per second depending on the time of day. Channel width and depth varied widely to accommodate changes in discharge.
That presented a significant challenge to the researchers. They had proven that acoustic Doppler profiling works even in the almost pristine water of supraglacial rivers, bouncing signals off of tiny bubbles and ice crystals in the water.
However, the frequencies that work best in shallow, slower moving water are not necessarily most effective in deeper, fast-flowing channels, notes Brittany Jenner, application engineer for Xylem’s SonTek brand.
SonTek RiverSurveyor-M9 used for high-quality measurements
In deep water, a lower-frequency, longer-wavelength acoustic signal is effective at providing a clear measurement of the bank and bottom, as well as the velocity and direction of flow, all of which are used to calculate volume. A higher-frequency, shorter-wavelength acoustic signal delivers a clearer profile of the velocity and flow in shallow water.
The Greenland team used a SonTek RiverSurveyor-M9, which automatically uses its depth and velocity readings to determine whether to use its 1.0 MHz or its 3.0 MHz beams for the highest quality measurements, Jenner says. The RiverSurveyor’s SmartPulse HD technology also selects its sampling cell size to optimize measurements in whatever conditions it is placed in.
During the survey, the RiverSurveyor-M9 was mounted on a SonTek HydroBoard II, which is pulled from bank to bank to gather data along a transect. The Greenland team gathered at least four transects each hour.
Improving science on glacial melting
In late 2017, the team published its 2015 Rio Behar data alongside the predictions generated by five leading ice melt models. The authors of the paper, which was published in the Proceedings of the National Academy of Sciences, represented a large and diverse group of investigators. They included not only geologists and hydrologists like Smith, Rennermalm, and the hardy grad students who gathered the measurements, but also Jenner and a group of other leaders in climate science and modeling.
For Brandon Overstreet, multiple trips to the Greenland ice sheet sum up the value – and the thrill – of fieldwork. It’s a level of detail that can’t be found in satellite imagery or fly-by science.
“My initial impression of the Greenland ice sheet was a large, featureless landscape that was only exciting at the edges where the icebergs were calving,” he says. “But on the ice surface, you have this incredible, dynamic system of rivers that behave like terrestrial rivers – in some ways, that are terrestrial rivers in overdrive.”
“I don’t want to live in a world where you collect everything you need by looking at a satellite image,” he adds.
Authors: Steve Werblow, Staff Writer, Mission: Water
Source: Xylem Inc.