Pump Performance Curve
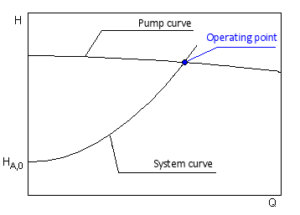
The graph of the curve is shown dropping from top left to bottom right with increasing rate of flow. The slope of the curve is determined by the pump construction and particularly by the design of the impeller.
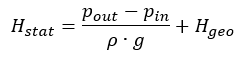
The characteristics of the pump duty curve is the inter-dependent relationship between capacity and head.
Each change of head effects a consequential variation in the rate of flow.
High rate of flow -> low head
Low rate of flow -> high head
Though it is the frictional resistance of the installed pipe system which determines a given pump capacity, the respective pump can take up only one duty point on its curve. This duty point is the intersection of pump H-Q curve with the system H-Q curve.
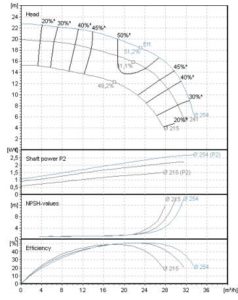
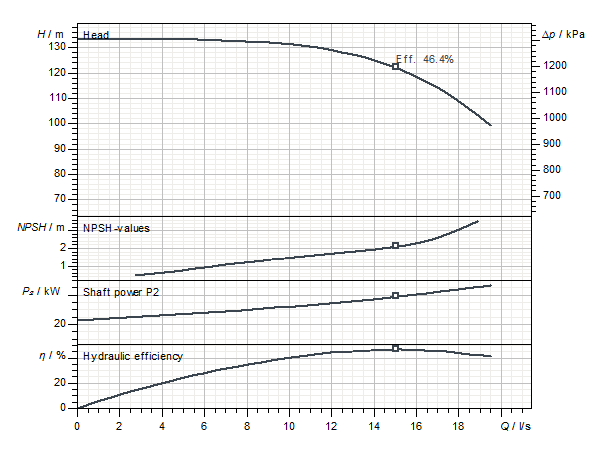
In addition to the Q-H performance curve, the following performance curves are often found for centrifugal pumps:
- Power
- Shaft power P2(Q)
- Electrical power consumption P1(Q)
- Efficiency
- Hydraulic efficiency ηhydr(Q)
- Total efficiency ηtot(Q)
- NPSH required NPSHreq(Q)
- Speed n(Q)