Continuous Monitoring of a Hydropower Project Reveals Massive Swings in Carbon Emissions
Continuous Monitoring of a Hydropower Project Reveals Massive Swings in Carbon Emissions (Image source: Xylem Inc.)
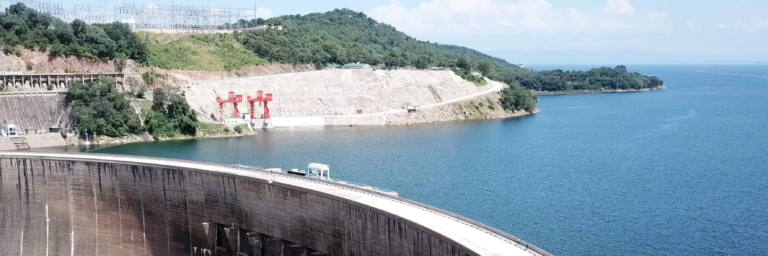
The Kariba Dam is a staggering site. It is located along Zambia’s border with Zimbabwe and spans the Zambezi River, one of Africa’s largest waterways. The dam is 579 meters wide, 128 meters tall and 24 meters thick, creating Lake Kariba, a 223-kilometer-long reservoir.
Although hydropower is considered a “clean” source of energy, hydropower reservoirs can produce greenhouse gas emissions from decomposing organic matter. However, how much emissions are generated, and how the emissions fluctuate, has not been widely studied.
A research team from the Swiss Federal Institute of Technology, ETH Zurich, led by Elisa Calamita and principal investigator Bernhard Wehrli, recently set out to measure greenhouse gas emissions from the Kariba Dam and how they fluctuate.
“It’s widely recognized that there are emissions from lakes and reservoirs, and that there can be downstream emissions from hydropower projects,” says Scott Winton, a research scientist at Stanford University in Palo Alto, California, who was an ETH post-doc researcher working with Calamita. “It's quite a challenge to capture all the seasonal dynamics to estimate those emissions accurately.”
Using continuous monitoring, instead of discrete sampling, the team found that the Kariba Dam hydropower project releases 18,000 to 35,000 metric tons of carbon, as carbon dioxide, per year. The ETH Zurich team also charted huge seasonal and even daily swings in carbon dioxide emissions. If the team had used only discrete sampling, instead of continuous monitoring, their calculations could have overestimated carbon emissions by up to 30% or underestimated them by as much as 90%.
What causes fluctuations in CO2 emissions?
Winton explains that organic matter decomposes when it falls to the bottom of deep lakes and reservoirs, releasing carbon dioxide (and, in anoxic conditions, methane). When the carbon dioxide (CO2) floats to the lake’s surface it is released into the atmosphere. However, much remains dissolved in the cold, deeper layers of the water profile.
This dissolved CO2 in the colder, deeper areas of the reservoir and downstream waterways contributes to the fluctuations in emissions. When seasonal temperatures change, the stratified water of the reservoirs mixes and can lead to large, brief emissions of this long-dissolved CO2. Additionally, if the turbines draw water from these deeper areas, it will be more heavily loaded with dissolved CO2.
Fluctuations can also be caused by variations in demand. At the Kariba Dam, customer demand for electricity peaks in the morning and late afternoon. When more water is released from the reservoir to meet demand, carbon emissions can also increase.
An urgent need for accurately measuring emissions
The challenge for most researchers is that they are limited to a few measurements and must extrapolate emissions from them.
“If you're reliant on a manual process – and with gas flux measurements, that’s what we're stuck with – you’re prone to missing those fluctuations,” Winton says. “What's so important about long-term, automated data gathering is it can help you capture seasonal discrepancies and even daily cycles related to operations, which we saw at Lake Kariba.”
The team warned of the potential for large inaccuracies in carbon release estimates from hydropower facilities in the Proceedings of the National Academy of Sciences. The paper highlights an urgent need for more accurate appraisals, as there are more than 58,000 dams that are five meters or higher around the world and nearly 3,700 hydropower dams currently under construction or in the planning process.
Collecting hourly data with YSI EXO2 multiparameter sondes
Winton says the key tool for recognizing and quantifying the emission fluctuations was the team’s suite of YSI EXO2 multiparameter sondes. Every hour for nearly a year, each sonde measured temperature, conductivity, pH, and dissolved oxygen.
"We couldn’t have done this study without that high-frequency information,” Winton says. “Having a sensor that’s able to sit there and measure for you hourly for a really long time allows you to answer a whole bunch of questions that you couldn’t otherwise. And, especially if you're interested in hydropower, a lot of those questions are happening at a really high frequency, hour to hour.”
ETH Zurich scientists measured carbon dioxide levels at 17 locations in the Zambezi, its tributaries, and in Lake Kariba. They also captured water samples to analyze back at the lab in Switzerland for carbon dioxide and methane. Finally, they used YSI handheld instruments to measure temperature, dissolved oxygen, conductivity, and pH to explore the influence of tributaries, measure conditions deep in the lake, and cross-validate the EXO2 data.
Preventing carbon leakage from hydropower dams
Long-term in situ water quality monitoring could be an important tool in preventing high levels of carbon leakage from future dams. Winton says that intake systems that can source water from different layers of a reservoir could be a helpful strategy for reducing CO2 discharges. Understanding a reservoir’s thermocline – the transition layer between shallow, warm water and cold, deep water – is a key part of this strategy.
“One thing you can do if you have a new dam, or you want to retrofit an existing one, is determine ‘where is the water coming from?’” he says. “If you have infrastructure where you can keep track of oxygen content in the deep water, oxygen in the shallow water, and the height of the thermocline, and then you have an intake system where you can choose the depth you’re sourcing the water, you could potentially avoid a lot of this problem.”
The biggest takeaway for Winton was the discoveries that can come from asking big questions of a multidisciplinary research team.
“We basically went to Zambia with a broad question, which was ‘what’s the status of the water quality in this basin and what are the threats to it? How are dams going to affect it?’” Winton says.
The answer has huge implications for understanding what’s happening deep in the reservoirs behind thousands of dams, and how decision-makers can better assess the impacts of hydroelectric power.
Source: Xylem Inc.