Pump Performance Chart

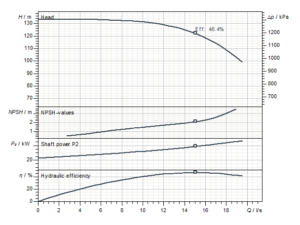
The pump performance chart is a summarized diagram containing multiple pump performance curves.
Pump Performance Chart

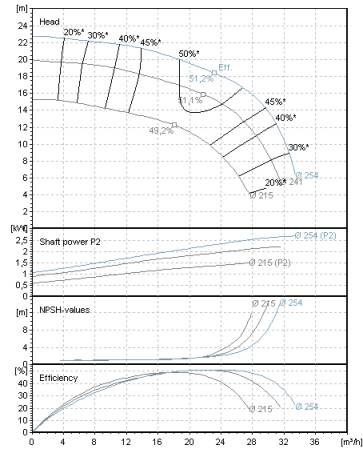
Pump performance chart with curves for different impeller diameters.

The performance curves differ in exact one parameter, such as
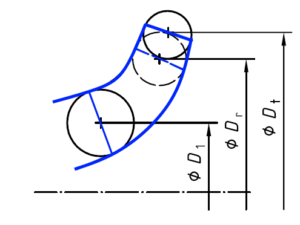
  • Impeller diameter
  • Propeller degree
  • Speed
  • Number of stages


More articles on this topic

System Curve

The system H-Q curve is essentially a parabolic curve representing the relation between the head (pressure) required to handle the respective rate of flow within a pipe system.

Read more

Head

The head is a measure of the pressure delivered by the pump. It is usually indicated in a characteristic curve as a function of the flow (throttle curve).

Read more